meteoJS examples
Some usage cases are presented via the examples below. Look into the source code of each example's page for the details of implementation.
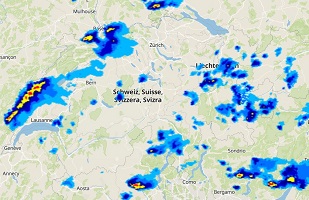
Radar images Synview
Simple configuration of a page to animate a serie of radar images.
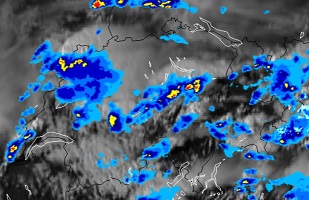
Satellite and radar Synview
Overlay of satellite and radar images, inclusive on-off-switch.
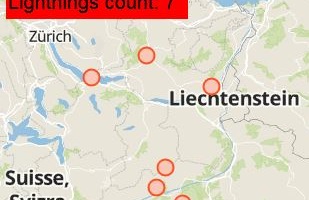
Lightnings Synview
Animation of lightnings (defined as a vector source). The lightning symbols can be changed via buttons.
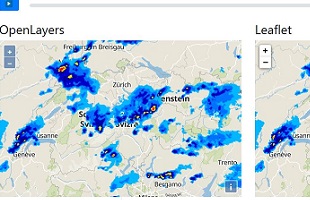
Leaflet Synview
Prove of concept for the usage with Leaflet.
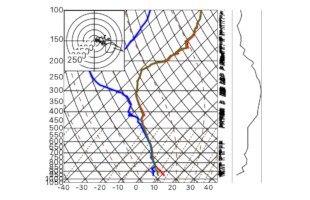
Default appearance Thermodynamic diagram
Simple sounding plot with default options.
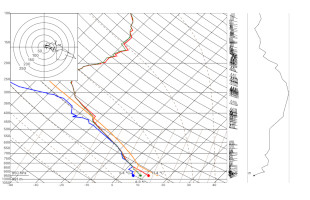
Parcel lift Thermodynamic diagram
Parcel lifts can be added to soundings. With a few lines of code, a parcel lift by click is drawn.
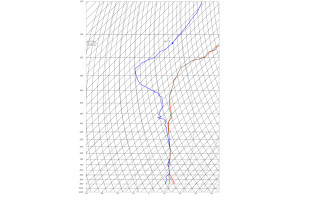
Raw SVG Thermodynamic diagram
The diagram can also be inserted directly into a raw SVG. Here's an example of a A4 print template.
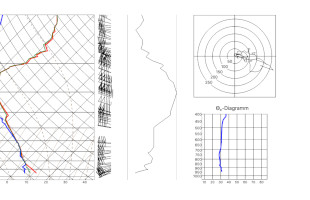
ϴe diagram Thermodynamic diagram
An example of a wide diagram, with an additional ϴe diagram.
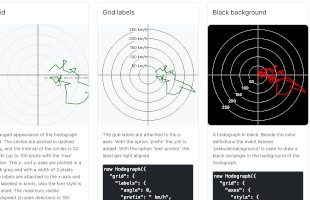
Hodograph Thermodynamic diagram
Several examples how to style the hodograph.
Coordinate system tests
Tests of each diagram type with external images.
Handling different set of times
Several examples of the usage of the timeline objects.
Animation
Several examples of the usage of the animation object.